In December of 2021, I wrote this article -
Budgeting Google Ads in 2022 - explaining my prediction that the average cost per click for Google Ads was going to increase by 20-40% in 2022.
Well, here we are at the end of 2022…and the question is: Did the cost per click (in Google Ads) increase, decrease, or both in 2022...and more importantly - what will happen in 2023?
To answer the first question about what happened in 2022 - let’s look at the two charts below.
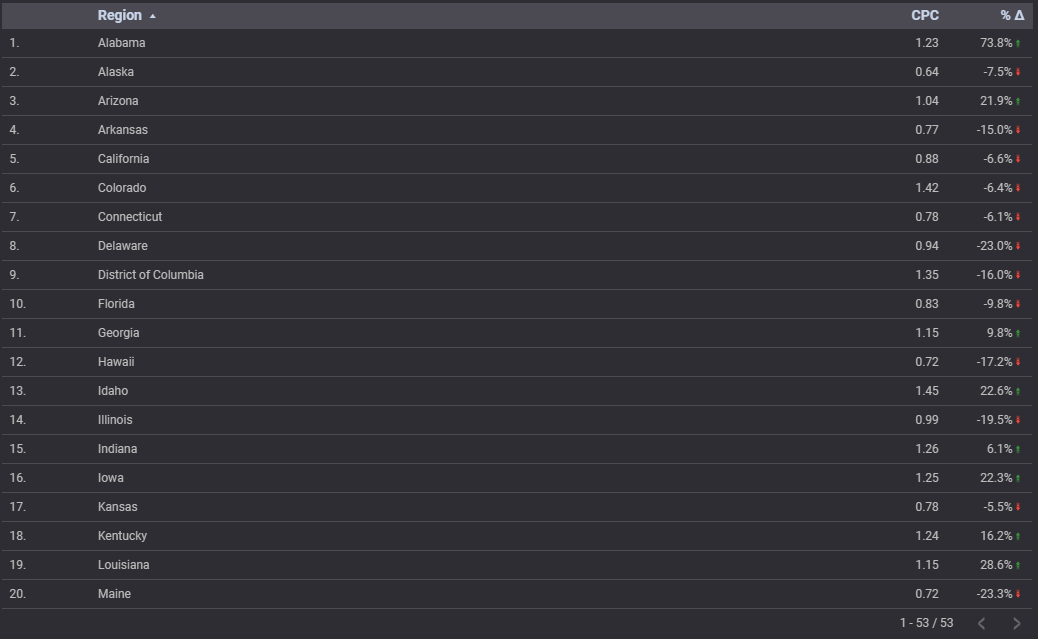
The first chart is January 1st, 2022 through December 11th, 2022 vs the same dates in 2021.
As you can see some states had a decrease in CPC, while others had an increase. There are quite a few factors that will influence the average CPC for a given market. Based on an understanding of how the Google Ads Auction works, I believe the 3 biggest factors are:
- Supply - essentially demand for new homes in that market. Also called “search volume.”
- Demand - how high builders are willing to pay per click.
- National/Public Builders - This one is debatable; however, big budgets can influence an entire market if one or more larger budget builders decide to have aggressive and way too high of keyword bids.
The second chart is the trend for the CPC for 2022. As you can tell, the range for the CPC for 2022 was $.95 to $1.16. This is the average for the builders we work with at Do You Convert.
My prediction for 2023
Volatile costs, dependent upon market conditions and region with a 5-30% increase in CPC for most builders.
Human actions are the driving force behind the average CPC for Google Ads. Google Ads is an auction-based advertising platform and is influenced by supply and demand.
- Supply is how many people are searching for the keywords we are bidding on.
- Demand is how much we (home builders) are willing to pay for each click.
If the demand is high due to marketers utilizing Google Ads to increase traffic to generate more leads and appointments, then the cost per click is very likely to rise, especially if the supply is limited.
Combine this auction format with our human tendencies and “budget personality” and you can see some markets have a very volatile marketplace for the clicks we are wanting.
By “budget personality” I mean:
- Some marketers must spend all of their budget each month. They have pressure to spend the budget, even more so when sales are behind. Saving money by understanding could actually be a failure on their part.
- Some marketers will always attempt to save money by lowering bids or being more conservative. Even these marketers might have to step out of their comfort zone to not lose traffic. Especially if other builders in their market make an aggressive push for more clicks, therefore increasing the demand and cost per click.
- Some builders already expect lower conversion rates in 2023 and have budgeted more spend.
What to do?
If you are thinking - “Thanks Ad Doctor, but where is my script to help my Google Ads have minimal cost increases?” You aren’t alone. Fortunately, we have some best practices that should help.
- 100% ignore Google Recommendations. They will only drive up your costs and leave you with fewer real and qualified leads.
- Get comfortable with Google Ads. We have proprietary technology to keep our cost per click lower than most, however, we work with quite a few builders and need this technology. If you are managing a single market or even multiple markets, you can still do this manually. Increase and decrease your bids until you are spending what you need to spend. I have found most marketers might adjust bids 1-2x and then leave it. Lowering your cost per click to be efficient for your budget will honestly take 15-20+ adjustments.
- Hold your vendors accountable. If you are not managing your ads yourself - you can simply hold your vendors more accountable for efficiency within your given budget. Without being overbearing…the old phrase “the squeaky wheel gets the grease” very much holds true.
About the data:
The data used for the charts is aggregate data from the builders we work with. While this is not perfect, as the data is biased based on our management - this is likely the largest data size for Google Ads in the Home Building Industry. The data below is broken down by the Network the Ads were displayed. The Search Network data was used for all of the charts in this blog post.