Summer is officially here, but that means we are getting closer to the final switch to GA4. We have been spending a lot of time getting to know the GA4 platform over the past months, and now we are helping to spread the knowledge and hopefully ease some anxiety around the switch.
In my last post, I walked through the new Acquisition reports in GA4 and shared where to find our most used metrics. Today, let’s take a look at the new Engagement Reports.
In Universal Analytics, we frequently used the Behavior reports (as shown below) to discover how people interact with our websites. Additionally, the Conversions reports were frequently used to see where and how often our traffic was converting to a lead.
In GA4 these reports have been combined into the Engagement report.
One of the most important reports in UA was the “All Pages” report where we could see what pages people were visiting and it allowed us to analyze performance at a community level.
This is the report in Universal Analytics:
Fortunately, in GA4 the “Pages and Screens” report functions very similarly. You are able to filter pages and add your secondary dimensions to analyze the performance of your communities.
1. You can add a filter two ways on this report. Adding a filter here will filter the entire report including the charts and table below.
2. If you just want to quickly look up traffic for a specific community, you can search the table data here. It will only filter the table, so the charts above will not be affected.
3. You can toggle between different dimensions here. We prefer Page Path but you can look at page titles as well.
4. Use the plus sign to add your secondary dimension to analyze in further detail.
5. Note that Google renamed Pageviews to Views in GA4.
6. This shows the average number of pageviews per visitor to your site.
7. Here you can view the average amount of time people were actively engaged with each page.
Next up, we have the Events report. In Universal Analytics we cautioned against setting up too many events, as it could affect your bounce rate. That has changed in GA4. The new platform revolves around events, and it will not artificially inflate your engagement rate in the same way. (More about creating events and the ones we recommend later).
This Events report allows you to analyze the behaviors or actions people are taking on your site, and Google has made it much easier to create custom events.
1. You can add a secondary dimension of Page Path to see where each event is taking place.
2. View the total number of each event triggered in your selected time period.
3. View the average number of events per user. So, if you have a “View Quick Move-In” event set up, you would be able to see how many homes on average each person views.
Last, but not least, is the Conversions Report. This report is pretty straightforward, showing you how many conversions happened on your site within your selected time period.
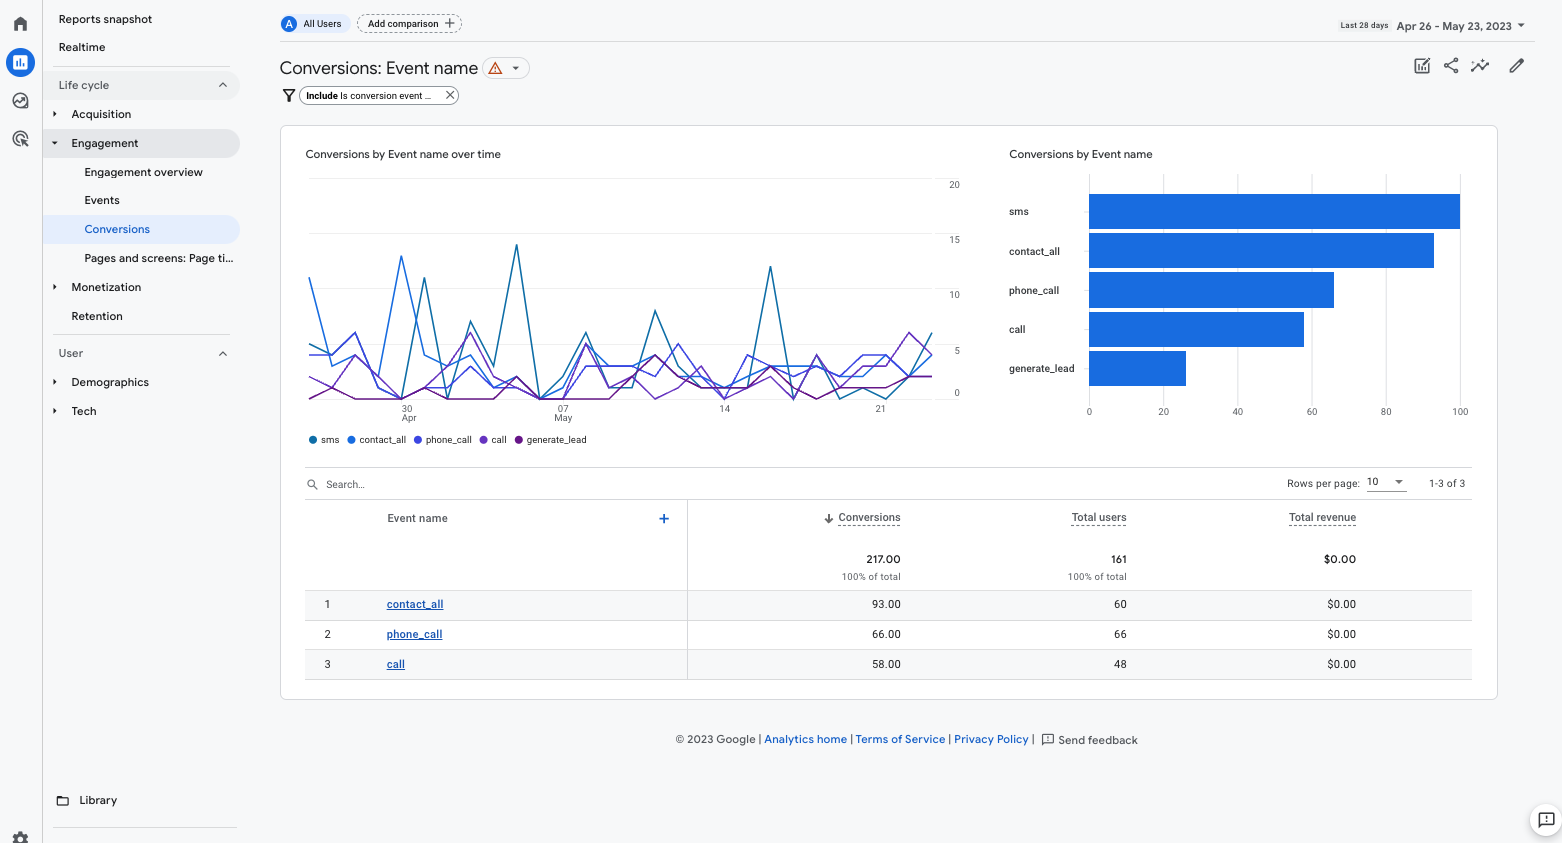
To discover more about each conversion type, simply click on the Conversion name and it will bring you to a new window broken out into conversions by channel grouping. You also have the option to switch to campaign, source, or medium.
Keep an eye on our blog for more GA4 information. For more tips, tutorials, and walkthroughs of GA4 created specifically for the homebuilding industry, join us in DYC All Access!


